
How to Calculate the True ROI of Selling on ONDC vs Amazon vs Flipkart (With Real Cost Comparisons)
Compare the true cost of selling on ONDC, Amazon, and Flipkart. Learn how commissions, advertising, storage, returns, and logistics affect your profit with real examples and ROI calculations.
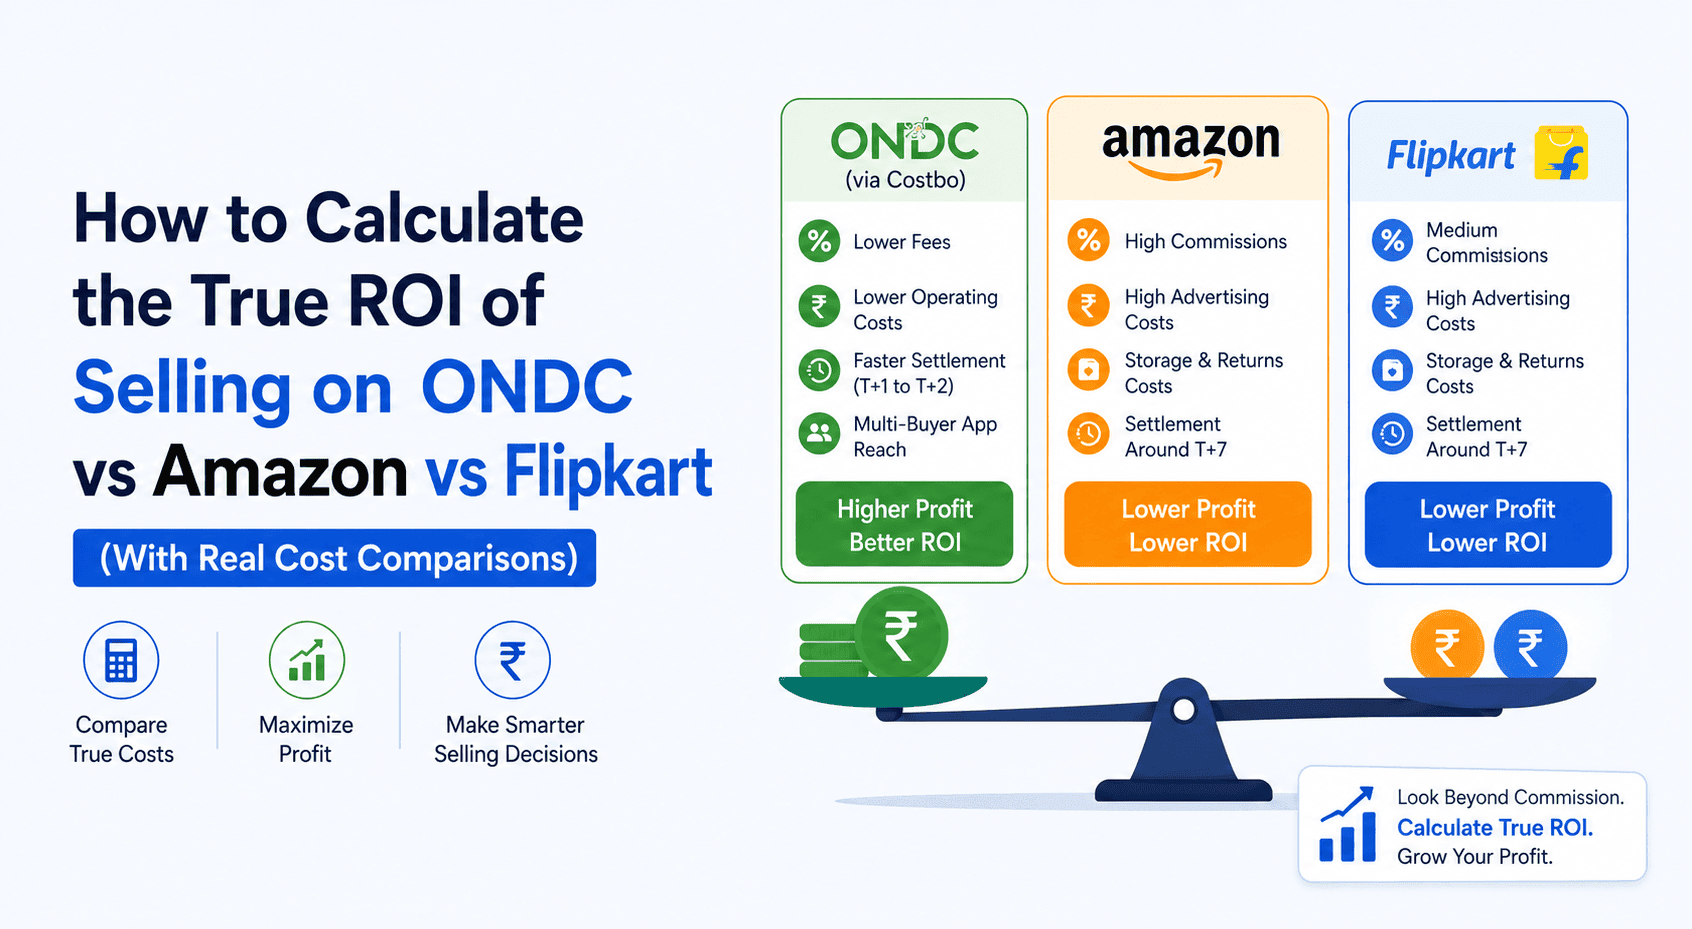
Commission Isn't the Real Cost of Selling
Many businesses compare marketplaces using only one number—commission percentage. For example, Amazon charges 15–35% depending on the category, Flipkart charges around 4–22%, while ONDC buyer app fees are generally much lower.
But commission is only one part of your selling cost.
The real question every business should ask is:
"How much money do I actually keep after paying every selling cost?"
This is where Total Cost of Sale (TCS) becomes important.
If two platforms generate the same sales but one leaves you with ₹15 lakh more profit every year, that's the platform delivering the better ROI.
In this guide, we'll calculate the true ROI of selling on ONDC, Amazon, and Flipkart using realistic examples across different product categories.
What is Total Cost of Sale (TCS)?
Total Cost of Sale represents every expense involved in selling a product online.
Instead of looking only at marketplace commission, calculate:
Total Cost of Sale = Platform Fees + Payment Charges + Logistics + Advertising + Returns + Storage + Technology Costs
Many businesses ignore hidden costs such as advertising, warehousing, and return handling. These expenses often reduce profits much more than commissions alone.
What Costs Should Sellers Compare?
Although actual fees vary by category and fulfillment model, sellers should evaluate every cost instead of comparing commission alone.
Example: Selling a ₹500 Product
Let's compare a product priced at ₹500.
Even if actual charges vary, this example clearly shows how hidden operational costs can significantly affect profitability.
Category-Wise ROI Comparison
Different product categories have different cost structures.
FMCG
Since FMCG products have relatively low margins, reducing selling costs has a direct impact on profitability.
Fashion
Fashion businesses usually experience higher return rates.
Fashion brands that already have customer demand can improve profitability by lowering platform dependency.
Electronics
Electronics sellers often compete on price.
How Costbo Helps Reduce Selling Costs
Costbo is designed to reduce operational expenses while helping businesses sell across multiple ONDC buyer apps.
Some key advantages include:
- ONDC Protocol 1.2+ compliant
- Multi-buyer app distribution
- No need to manage multiple seller accounts
- Integrated inventory management
- Multiple logistics partners
- Real-time order dashboard
- Transparent T+1 to T+2 settlements
- Analytics and reporting
- WhatsApp-first seller support
Instead of paying separately for multiple tools, businesses manage everything from one platform.
Hidden Costs Most Sellers Ignore
Many profitability calculations ignore these expenses.
1. Advertising Costs
On Amazon and Flipkart, paid advertising is often necessary to remain visible.
Popular keywords can become increasingly expensive, reducing overall margins.
2. Storage Charges
Marketplace fulfilment programs charge warehousing fees.
Slow-moving inventory increases storage costs every month.
3. Return Processing
Fashion and electronics categories may experience return rates exceeding 20%.
Every return creates additional logistics and handling expenses.
4. Payment Delays
Waiting several days for settlements affects working capital.
ONDC generally follows T+1 to T+2 settlement cycles, helping businesses improve cash flow.
5. Customer Ownership
Traditional marketplaces own most of the customer relationship.
ONDC gives sellers greater control over pricing, operations, and business growth through their chosen seller platform.
What Does ₹1 Crore GMV Look Like?
Let's assume a business generates ₹1 crore in annual sales.
*Actual operating costs vary depending on category, logistics model, advertising spend, and return rates.
For businesses selling large volumes, even a 5–10% reduction in operating costs can translate into several lakhs of additional annual profit.
When Does ONDC Deliver Better ROI?
ONDC is particularly attractive when businesses want to:
- Reduce platform dependency
- Improve profit margins
- Reach customers through multiple buyer apps
- Receive faster settlements
- Build long-term brand presence
- Control catalog, pricing, and logistics
Traditional marketplaces still offer larger customer traffic, making them useful for launching new products or acquiring initial customers. Many successful brands use Amazon and Flipkart alongside ONDC as part of a multi-channel strategy.
Final Thoughts
Looking only at marketplace commission can lead to the wrong business decision.
The better approach is to calculate the Total Cost of Sale, including platform fees, advertising, logistics, storage, returns, and payment cycles.
For businesses focused on long-term profitability, ONDC offers a compelling opportunity to lower operating costs while maintaining greater control over pricing, logistics, and customer relationships.
Platforms like Costbo simplify selling on ONDC by providing catalog management, inventory control, logistics integration, analytics, transparent settlements, and multi-buyer app distribution through a single dashboard.
As ONDC continues to expand across India, evaluating the true ROI rather than just commission rates will help businesses choose the right sales channels for sustainable growth.
Frequently Asked Questions
1. What is Total Cost of Sale (TCS)?
TCS is the total expense of selling a product online, including commissions, advertising, logistics, returns, storage, payment processing, and technology costs.
2. Is ONDC cheaper than Amazon or Flipkart?
In many cases, ONDC can have lower operating costs, especially for sellers who spend heavily on marketplace advertising and fulfilment. Actual costs depend on your category and business model.
3. Why shouldn't I compare only commission rates?
Commission is only one part of the selling cost. Advertising, returns, storage, logistics, and settlement cycles also affect overall profitability.
4. How does Costbo improve ROI?
Costbo helps businesses reduce operational complexity through multi-buyer app distribution, inventory management, logistics integration, transparent settlements, analytics, and ONDC compliance.
5. Should I leave Amazon or Flipkart and sell only on ONDC?
Not necessarily. Many businesses achieve the best results with a multi-channel strategy, using ONDC alongside traditional marketplaces to diversify revenue and improve profitability.
References
- ONDC Official – https://ondc.org
- ONDC Open Data – https://opendata.ondc.org
- DPIIT, Government of India – https://dpiit.gov.in
- Amazon India Seller Fee Documentation
- Flipkart Seller Hub Pricing Documentation
- Costbo Research & Industry Analysis
Related post
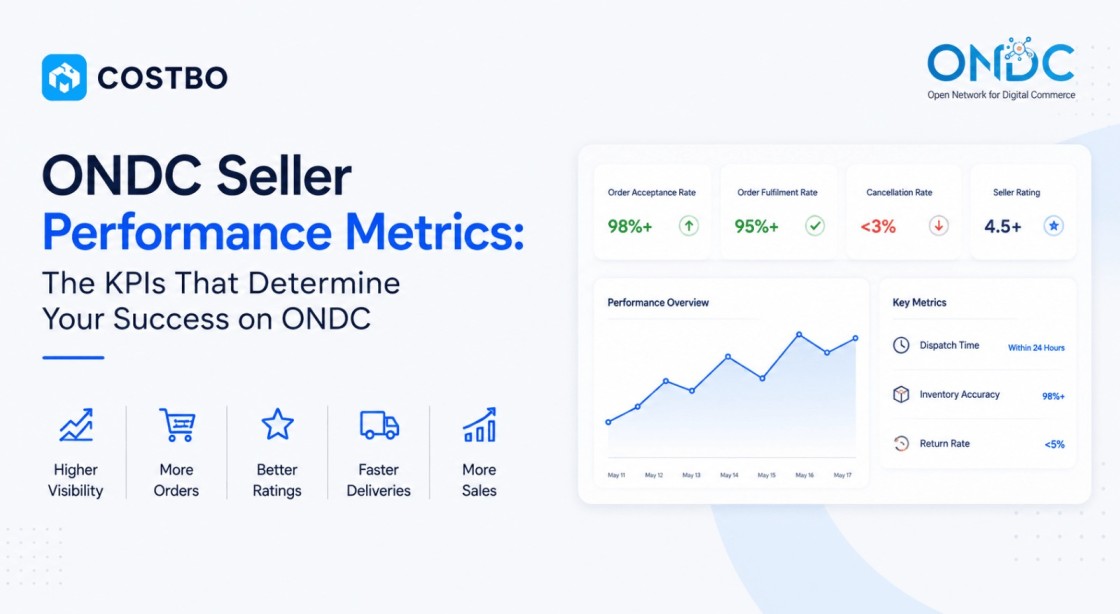
ONDC Seller Performance Metrics: The KPIs That Determine Your Success on ONDC

How to Get More Orders from ONDC Buyer Apps: The Complete Seller Visibility Guide

What Are the Key Features of an ONDC Seller Platform?
Sounds like COSTBO might be the right choice for your business?
Get started by registering your business today! If you have any questions, we're here to help. Our team will reach out to you with detailed information about our offerings, product features, and a demo